This post is on how to get your spreadsheets ready for automation with Power Automate. In most cases of the corporate world, I’ve found that the best way to maintain automated reporting data in excel is by utilizing a data/master system.
This means that you create a spreadsheet dubbed a Master which will maintain your reporting data as a database and contain your pivot tables or other data formats for distribution. The Data is what is used to update the values in the master and is what comes from a system extract, or other means.
DO NOT share the master data with your end users. Rather, set up a Power Automate job to create a distribution copy to a different directory.
Create your Master Spreadsheet
The Master spreadsheet is where your data will reside after its been pulled out of the Data spreadsheet. The only set up involved here is to create your columns and baseline data as you would like the spreadsheet to look, then create any supporting pivots or visuals for this data.
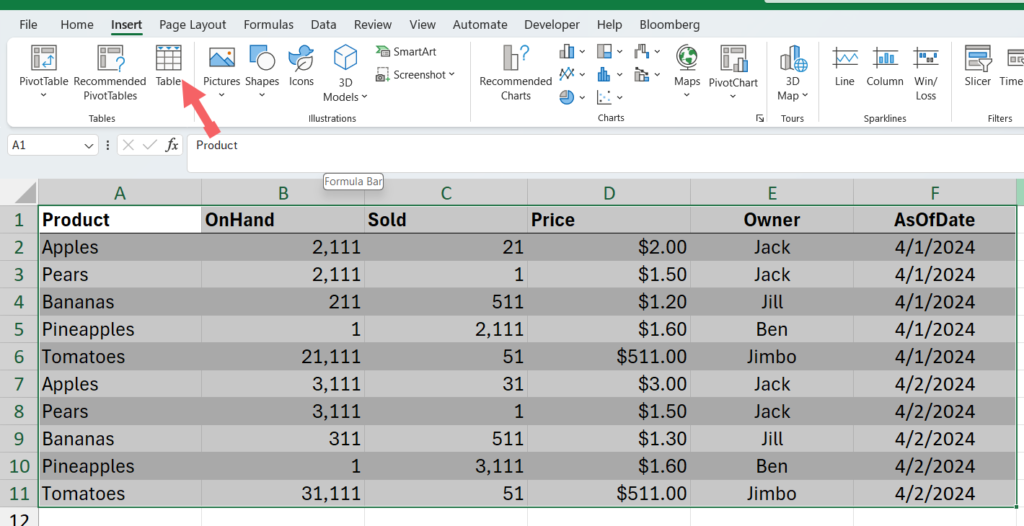
IMPORTANT: Power Automate only works with data tables. After you create your columns and data, highlight it and go to “Insert -> Table”

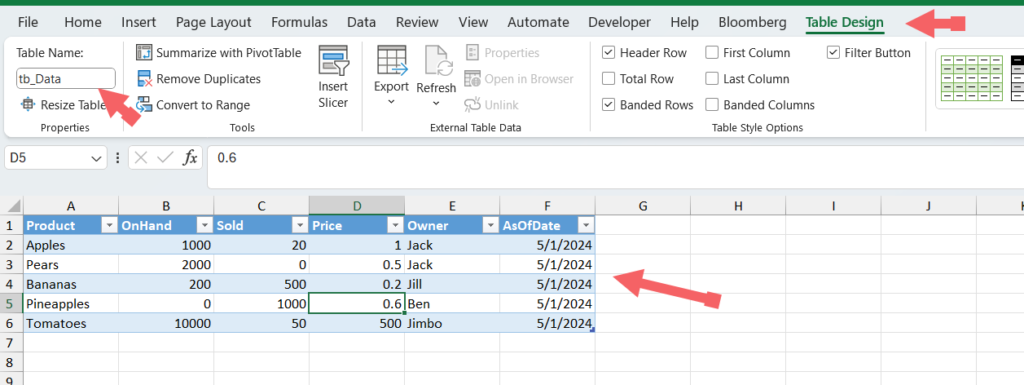
After the table is created, go to the Table Design toolbar and rename the table to preferably standardized naming convention. I like using prefixing all tables with tb_ but that’s up to you.

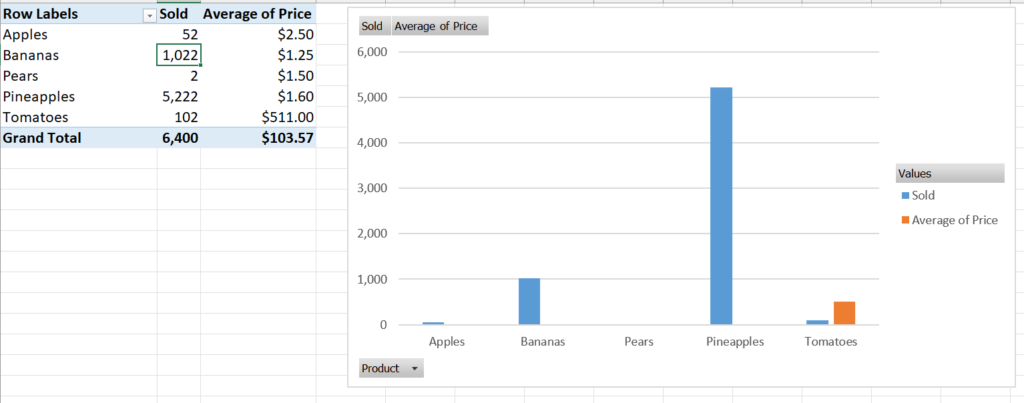
Now you can create a pivot table and reference the entire dataset with just tb_Master. Which means after the data is updated, the pivot table can be refreshed with all the updated data immediately.

Here is the final example report that we will be updating as new data is coming into the spreadsheet.

Create your Data Spreadsheet
Now that we have a Master spreadsheet, we will need to get the data. This can of course come from various sources like a system extract, or email. As of this post, tables are not exactly a common occurrence from people working with Excel (Though they should be). So you will need to make sure to create a table in this data sheet.
Here is our example sheet – lets pretend it came from a very fancy system.

As you can see its unformatted and raw which means Power Automate (Cloud) cannot interact with it. We will need to create a table and we will need to do it in an automated fashion.
Lets create an Office Script to do it.
Office Script: Create a Table
From Excel, go to the Automate tab on your toolbar and select New Script.

Copy and paste the following code into the code view.
function main(workbook: ExcelScript.Workbook, tableName: string, sheetName: string) {
    // Get the specified sheet
    let sheet = workbook.getWorksheet(sheetName);
    if (!sheet) {
        console.log(`The sheet named "${sheetName}" does not exist.`);
        return;
    }

    // Calculate the used range on the sheet
    const usedRange = sheet.getUsedRange();

    // Check if there is any data in the used range
    if (usedRange.getRowCount() === 0 || usedRange.getColumnCount() === 0) {
        console.log("The used range is empty.");
        return;
    }

    // Create a table for the entire used range
    const table = sheet.addTable(usedRange, true);

    // Set the name of the table
    table.setName(tableName);

    console.log(`Table named "${tableName}" created successfully on the "${sheetName}" sheet.`);
}
This script does the following:
- Accepts two parameters: The name you want to give your data table and the sheetname of the data you want to convert
- Turns any data on the spreadsheet into a table
Add a name to your script. I prefix it with Shared as this is script can be reused by any power automate flow.

Run the script to test it and you should see the colors update to reflect that is now a table with the name you passed in.


Now you’re ready to automate the move from a raw data sheet to your master sheet!
